Sales Pipeline
Sales Pipeline is an essential tool in Salesshaper, which organizes your created deals by month, and sorts them by sales stages and expected closing dates. You can utilize the pipeline to work on your target deals for the month, and advance these deals into your monthly forecast. If the deals in the pipeline cannot be closed within the same month, you may move them over to the next month's pipeline or the month after.
The traditional sales pipeline is in the funnel shape with those most likely to convert at the bottom. However, in Salesshaper, the funnel has been reversed to display the most likely to convert on top. This benefits the mobile users, as they could access the deals with higher possibility to be closed more quickly.
Sales Pipeline List
When you click into the Deals module, you will get your sales pipeline list by default.
A typical Salesshaper pipeline list is presented in the image below.
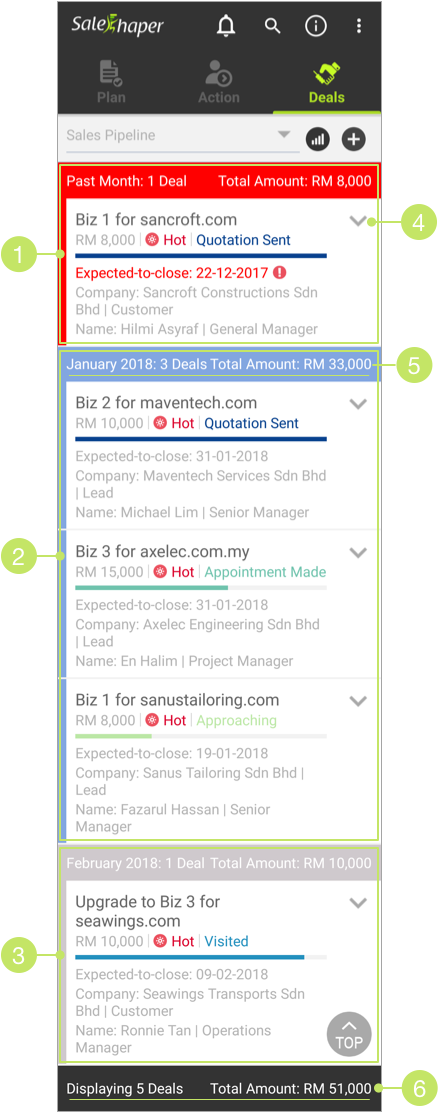
1. Deals Expected-to-close on Past Months
The deals that are expected-to-close on past months are grouped under the "Past Months" section, labeled in red. The deals that fall into this section are sorted by their expected-to-closed dates, with the earliest on top. This allows the sales person to identify the overdue deals, and take proper action immediately.
2. Deals Expected-to-close on This Month
The deals that are expected-to-close on this month are grouped together and labeled in blue. These deals are sorted by stages, with Quotation Sent on the top most, and Approaching at the bottom. Deals that are at the same stage will be sorted by expected-to-closed dates; those with earlier dates will be on top. If there are deals with the same stage and expected-to-closed date, then, those with higher deal amounts will be placed on top of the others.
If the expected-to-closed date has passed, the date will be displayed in red font, with an exclamation mark, to alert the users.
3. Deals Expected-to-close on Future Months
Those that are labeled in grey are expected-to-close on future months. Similar to deals expected-to-close on current month, these deals are sorted by stage, expected-to-closed dates and amount.
4.Expand Icon
You can click on the ![]() icon to see the contact details of the account that is associated to each deal.
icon to see the contact details of the account that is associated to each deal.
5. Total No. of Deals and Total Amount Per Section
Salesshaper conveniently shows you the summary of each pipeline section— the total number of deals as well as their total amount. This gives you an idea of how much you could expect to closed per month.
6. Total No. of Deals and Total Amount
These are the total number and total amount of deals that are being displayed in the pipeline.
Sales Pipeline Chart
To view the visual summary of your sales pipeline, click on the ![]() button from the sales pipeline list.
button from the sales pipeline list.
You will see all possible sales revenue of every month in different stages for six months down the road.
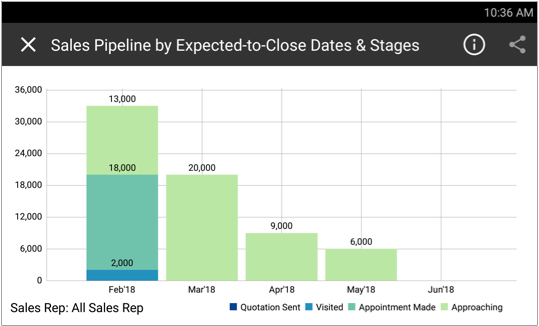
Each month’s bar provides the breakdown in the amount of deals of different stages. It helps you to plan if deals of early stages should be pushed back to the following months, or deals in advanced stages should be brought forward to this month.
Did not find an answer to your question? Write to us at support@salesshaper.com